Final Report
1. Introduction
The goal of this analysis is to understand the factors which impact the compressive strength of concrete, a critical property in construction.
Predicting compressive concrete strength based on component proportions can help manufacturers optimize material usage and ensure structural reliability.
So via this analysis, we aim to provide practical recommendations for real-world applications, by applying data mining techniques, particularly linear regression, including both custom-built via gradient descent and statistically validated using software "statsmodels".
2. Results
Model from Part B - Q2.3
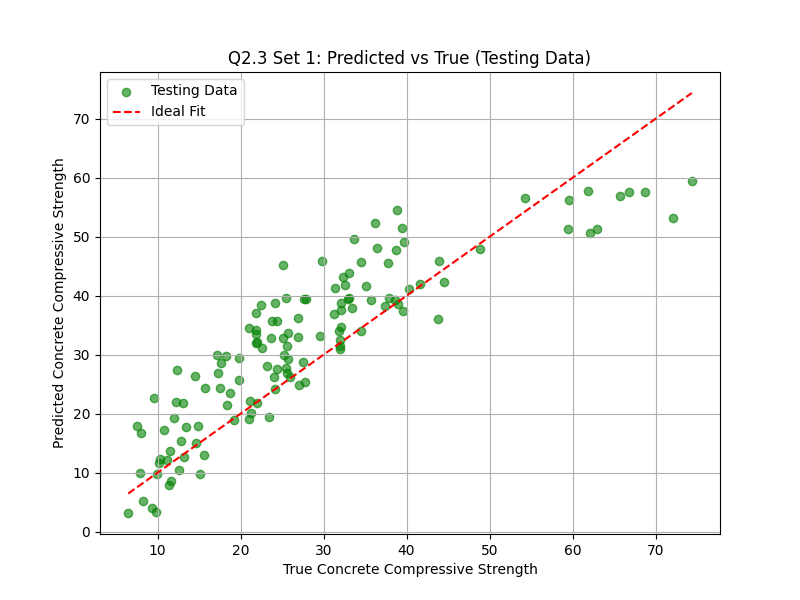
Multivariate Linear Regression with Gradient Descent (Pre-processed Predictors, Raw Response)
-
Parameters:
- m: [ 1.03198275e+01 2.78827073e+01 7.45159185e+00 -5.12468027e+00 3.11466814e+00 3.57357621e-01 7.71318550e-03 1.02909491e+01 ]
- b: 28.0044317376294
- : 0.01
- Epochs: 5000
-
Peformance:
- MSE on Testing Data: 67.87198233457188
- VE () on Testing Data: 0.6894830160041516
-
Why Trustworthy?:
High R-squared value (0.69), explaining 69% of the variance in compressive strength, as the pre-processed predictors enhances its reliability. -
Recommendations:
- Increase
CementandBlast Furnace Slagproportions, while decreasingWatercontent, to improve strength significantly. Fine Aggregatehas a smallest impact on strength. So we may reduce its use to lower costs.
- Increase
-
Figure:
Model from Part C - Q2.3
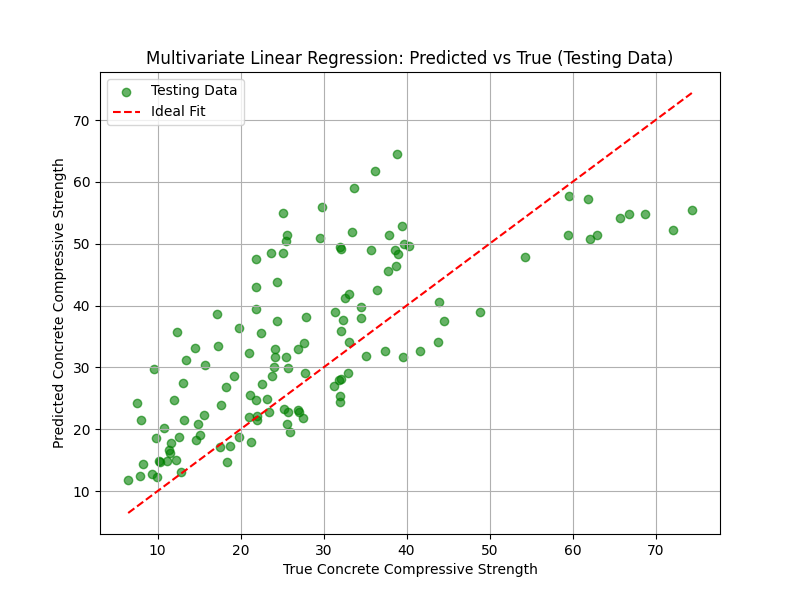
Multivariate Linear Regression with Statsmodels (Pre-processed Predictors, Raw Response)
-
Parameters:
- m: [ 15.3584 50.0728 22.4310 -2.0918 0.1704 3.5054 4.1012 10.5111 ]
- b: 19.9179
-
Peformance:
- MSE on Testing Data: 80.73582880174308
- VE () on Testing Data: 0.6306304133516871
-
Why Trustworthy?: Fitted with statsmodels (which means this model optimizes using Closed Form Solution), showing a high R-squared value (0.63), and the use of pre-processed predictors ensures its reliability.
-
Recommendations:
- Components suggestion for
Cement,Blast Furnace Slagandwaterare consistent with the previous model. - The
fly ash's weight of this model has become greater than thecement. So it could also be considered as one of the most significant factors. - In this model,
Superplasticizerturns to be the minimal impact feature. So we may reduce its use to lower costs.
- Components suggestion for
-
Figure:
3. Methods
Model from Part B - Q2.3
I used a multivariate linear regression model optimized with gradient descent. The algorithm iteratively adjusts coefficients (m) and intercept (b) to minimize the mean squared error (MSE) between predictions and true values.
-
Pre-processed?
Yes. As following:Feature Transformation Method Cement Standardization Blast Furnace Slag Normalization Fly Ash Normalization Water Log and Standardization Superplasticizer Normalization Coarse Aggregate Standardization Fine Aggregate Standardization Age Log and Standardization -
Hyperparameters:
- Learning Rate (): 0.01
- Epochs: 5000
- These were chosen by error values, starting with the bigger ( , $ Epochs = 1000) and then trying to decrease until convergence was achieved without overshooting. And Epochs should be set high enough to stabilize MSE.
Model from Part C - Q2.3
I used the t-test to obtain p-values for each feature parameter in a multivariate linear regression model fitted with statsmodels.OLS, which helps to identify statistically significant features.
The T-test assesses whether the coefficient of each feature is significantly different from zero, indicating its importance in predicting compressive strength. And the P-value indicates the probability of observing the data if the null hypothesis is true -- is considered statistically significant.
-
Pre-processed? How?
Yes. As following:Feature Transformation Method Water Log and Standardization Coarse Aggregate Standardization Fine Aggregate Standardization I utilize Log transformation & Standardization to
Waterfeature, and Standardization toCoarse Aggregate,Fine Aggregatefeatures. And all of their P-value turned into 0.000.Standardization: Standardization can help reduce multicollinearity.
Log transformation: Log transformation can reduce skewness and make distributions more normal, compressing the range of high values, which can reduce the variance.